

 The recent 2022 Oregon Vineyard & Winery report published by the Oregon Wine Board provides an opportunity to compare the Oregon and Washington wine industries across a series of metrics. (Also see my previous article on key takeaways.) Specifically, I looked at: number of wineries, total acreage, tons produced, price per ton, leading variety and its associated cost, cases produced, and other numbers. Here is what I found.
Wineries
As I wrote recently, Oregon has now surpassed Washington to have the second most wineries of any state in the country (1,116 in Oregon in 2022 versus 1,070 in Washington in 2022). On one hand, this is surprising, given how much larger the Washington wine industry is by a number of measures.
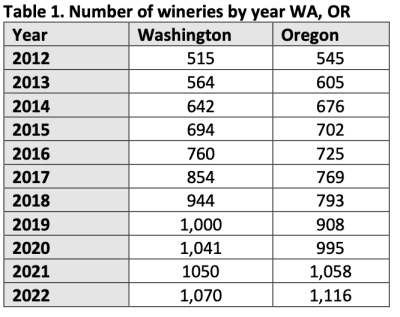 On the other hand, going back 10 years, Oregon had more wineries than Washington at that point in time. Washington having considerably more wineries than Oregon has only dates back to 2016, when Washington had 760 wineries to Oregon’s 725. The recent surge in Oregon wineries is not surprising considering the moment in the sun Willamette Valley is having.
Acreage
There are currently sizable differences in planted acreage between Washington and Oregon. As one would expect, Washington has considerably more.
However, with recent news about Ste. Michelle Wine Estates dropping 40% of its fruit contracts, there has been talk that Washington has 10,000 more planted acres than it needs. If the state were to subtract this acreage (to be clear, it is unlikely to subtract that entire amount), it would draw the two states much closer together in acreage. Planting in Oregon is also continuing at a quick clip, whereas Washington has recently leveled off somewhat.
Tons produced
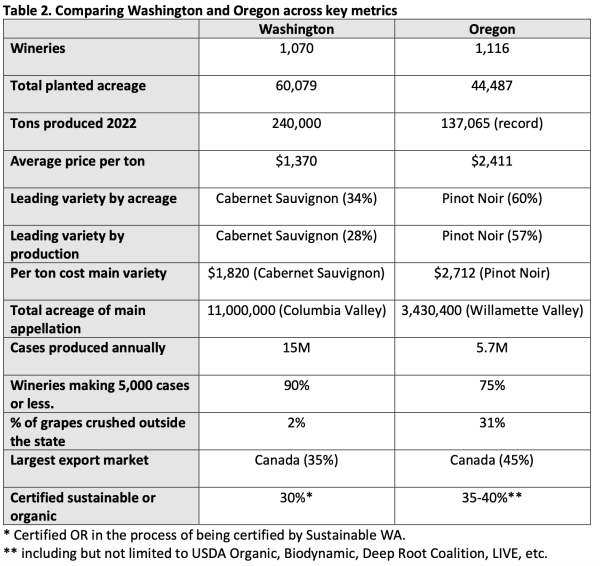 There are also significant differences, as one would expect, in the total tons produced by the two states. Oregon produced a record crop in 2022 (137,065 tons). However, Washington’s harvest in 2022 was 75% larger (240,000 tons). It was also a good bit below the state’s record of 270,000 tons.
Oregon is currently at a point where it routinely breaks tonnage records as the industry grows. In contrast, Washington’s record tonnage dates back to 2016. More recent years have been uneven in production due to a variety of environmental and market factors.
Average price per ton
There are also dramatic differences in the average price per ton of grapes. Oregon’s average price per ton is 76% above Washington’s. This is indicative of a number of things, from the cost of land to the cost of farming, the overall demand for specific varieties, and the costs associated with those varieties.
Lead varieties
As one would expect, the two states’ lead varieties are radically different. Oregon’s is Pinot Noir. This variety makes up a staggering 60% of planted acreage. In Washington, it is Cabernet Sauvignon, which makes up 34%.
These two varieties also have substantial differences in average prices. Oregon Pinot Noir is considerably more expensive per ton than Washington Cabernet Sauvignon.
Note that the dollar number in the table looks at Oregon as a whole. If one were to look at Willamette Valley specifically, this number would surely go up. Similarly, if one were to look at, say, Red Mountain Cabernet Sauvignon versus Washington Cabernet, those two numbers would be markedly different.
Case production
No surprise, Washington produces a lot more wine than Oregon does. Oregon makes approximately 5.7M cases of wine annually. Washington currently makes a little over two and a half times that, at 15M cases.
Winery size
There are also significant differences in the size of wineries in the two states. In Oregon, 75% of producers make less than 5,000 cases annually. In Washington, they make up 95% of producers.
Bottom line, both states are dominated by small wineries. However, Washington has a much larger percentage of small producers than Oregon does.
Grapes crushed in-state versus out-of-state
One of the more interesting differences is in the percentage of fruit crushed outside of each state. According to the Washington Wine Commission, approximately 2% of Washington’s fruit is crushed outside the state. (Full disclosure: I have consulted for the Washington State Wine Commission since 2013.)
In Oregon, that number is an astounding 31.1%! According to the Oregon Wine Board, that number has gone from marginal in 2012 to 24.1% in 2018 to 31.1% now. Wow.
Although it’s not entirely clear where this fruit is going, Oregon’s huge percentage of fruit crushed outside the state likely reflects its shared border with California. Additionally, it is indicative of the current avarice for the state’s wines from producers and consumers alike.
Export markets
Canada is the largest export market for both states. However, Canada makes up approximately 10% more of Oregon’s exports.
Sustainable acreage
Finally, it is difficult to make direct comparisons of the amount of sustainable or organic wine grape acreage farmed. The 2022 Oregon Vineyard & Winery Report estimates that 35-40% of the state’s vineyards are certified.
Washington does not currently formally track this number. However, the Washington Wine Commission estimates that 30% of the state’s vineyards are either certified by Sustainable WA or are in the process of being certified. This certification program was launched in 2022. Of note, there are substantial differences between the various certification programs.
NOTE: Northwest Wine Report is wholly subscriber funded. The site currently has 70% of the minimum number of paid subscribers needed to be financially viable. Please subscribe to support continued independent content and reviews on this site.
To receive articles via email, click here.


I would be curious to know how many wineries are in the 2000 cases/year category.